Design of Experiment (DOE)
Hello everyone, welcome back to my blog!!! ☺ It has been a long time since I last updated my blog and I am pretty excited on what I have got for you today. Today, I'll be sharing about the Design of Experiment (DOE). 🍥 DOE is a statistics-based approach to designing experiments, it is a methodology to obtain knowledge of a complex, multi-variable process with the fewest trials possible. This is also known as the optimisation of the experimental process itself.
So, I have been tasked to perform factorial design on a case study and this blog will be focusing on this aspect.
CASE STUDY:
What could be simpler than making microwave popcorn? 🍿🍿 Unfortunately, as everyone who has ever popcorn knows, it's nearly impossible to get every kernel of corn to pop. Often, a considerable number of inedible "bullets" (unpopped kernels) remain at the bottom of the bag. What causes this loss of popcorn yield? In this case study, three factors were identified:
- Diameter of bowls to contain the corn, 10 cm and 15 cm
- Microwaving time, 4 minutes and 6 minutes
- Power setting of microwave, 75% and 100%
8 runs were performed with 100 grams of corn used in every experiment and the measured variable is the amount of "bullets" formed in grams and data collected are shown below:
- Factor A: Diameter
- Factor B: Microwaving Time
- Factor C: Power
Run Order | A | B | C | Bullets (grams) |
1 | + | - | - | 3.5 |
2 | - | + | - | 1.6 |
3 | - | - | + | 0.7 |
4 | + | + | - | 1.2 |
5 | + | - | + | 0.7 |
6 | + | + | + | 0.3 |
7 | - | + | + | 0.5 |
8 | - | - | - | 3.1 |
Document and Describe how you performed the Full Factorial Data Analysis
Determine the effect of single factors and their ranking.

Figure 1: Effect of Single Factors Using Full Factorial Design
As seen in Figure 1, the magnitude of the gradient for Factor C is the highest with (1.8), followed by Factor B (1.1) and then Factor A (0.05). Therefore, Factor C has the most significant effect on the amount of "bullets" formed, followed by Factore B and A.
When Factor C (Power) is increased from 75% to 100%, the amount of "bullets" formed decreases. This matches the hypothesis relationship as when the power is higher, more popcorn should pop, and thus amount of "bullets" formed will decrease.
When Factor B (Microwaving Time) is increased from 4 minutes to 6 minutes, the amount of "bullets" formed decreases. This also matches the hypothesis relationship as when the microwaving time increases, more popcorn will pop as there is more cooking time. This left a lesser amount of "bullets" formed.
When Factor A (Diameter) is increased from 10cm to 15cm, the amount of "bullets" formed decreases. This matches the hypothesis relationship as when the diameter of the bowl increases, the popcorn are more spread out and there is more surface area to volume ratio with heat provided by microwave. Therefore, the amount of "bullets" formed decreases.
Ranking | Factors |
1 | C (Power) |
2 | B (Microwaving Time) |
3 | A (Diameter) |
Determine the interaction effect.


Figure 2: Interaction Effect of A x B (Full Factorial Design)
As seen from Figure 2, the gradients of both lines are different (one is + and the other is -). Therefore, there is a significant interaction between A and B.
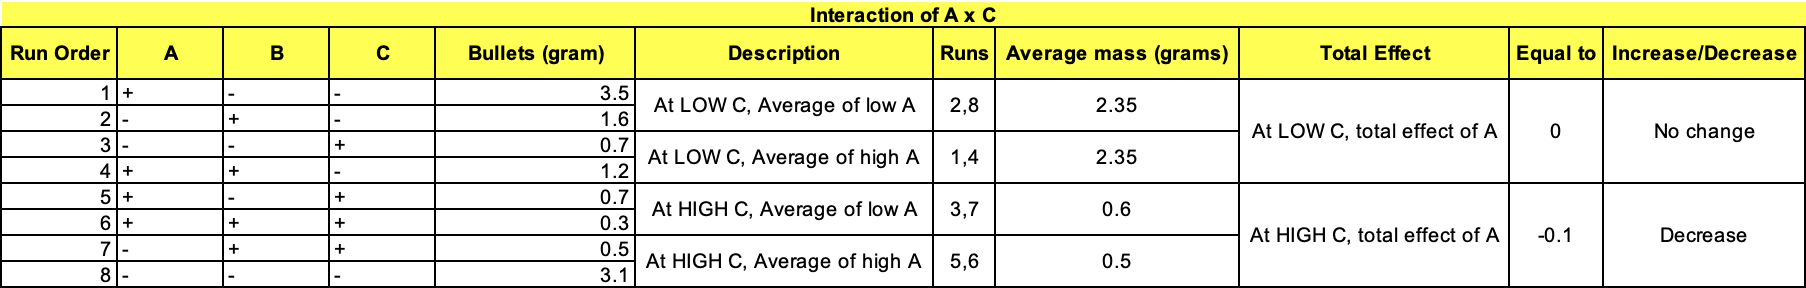

Figure 3: Interaction Effect of A x C (Full Factorial Design)
As seen in Figure 3, since both lines have a different gradient, there is an interaction between A x C but the interaction is not that significant because the lines are almost parallel.


Figure 4: Interaction Effect of B x C (Full Factorial Design)
As seen in Figure 4, the gradient of both lines is negative and has different values. Therefore, there is a significant interaction between B and C.
In conclusion, Factor C (Power) is the most significant factor affecting the amount of "bullets" formed, followed by Factor B (Microwaving Time) and A (Diameter). Then for the interaction between factors, it is found that A x B and B x C have a more significant effect on the amount of "bullets" formed whereas A x C has almost no significant effect on the amount of "bullets" formed. To achieve the least amount of "bullets", it is best to microwave popcorn using a 15cm diameter bowl for 6 minutes using 100% power.
Click Full Factorial Design to access the MS Excel file
Document and describe how you performed the fractional data analysis by selecting 4 experiments from the full factorial data that are orthogonal.
Determine the effect of single factors and their ranking.
Before carrying out the fractional factorial design, it is important to choose the runs which have a balanced design where all factors occur (both low and high levels) the same number of times. This is said to be orthogonal there are good statical properties.
I have chosen Run Order 4, 5, 6 & 7 to perform the fractional factorial design.


Figure 5: Effect of Single Factors using Fractional Factorial Design
As seen in Figure 5, the magnitude of the gradient for Factor C is the highest with (1.55), followed by Factor B (1.05) and then Factor A (0.85). Therefore, Factor C has the most significant effect on the amount of "bullets" formed, followed by Factore B and A.
When Factor C (Power) is increased from 75% to 100%, the amount of "bullets" formed decreases. This matches the hypothesis relationship as when the power is higher, more popcorn should pop, and thus amount of "bullets" formed will decrease.
When Factor B (Microwaving Time) is increased from 4 minutes to 6 minutes, the amount of "bullets" formed decreases. This also matches the hypothesis relationship as when the microwaving time increases, more popcorn will pop as there is more cooking time. This left a lesser amount of "bullets" formed.
When Factor A (Diameter) is increased from 10cm to 15cm, the amount of "bullets" formed decreases. This matches the hypothesis relationship as when the diameter of the bowl increases, the popcorn are more spread out and there is more surface area to volume ratio with heat provided by microwave. Therefore, the amount of "bullets" formed decreases.
Ranking | Factors |
1 | C (Power) |
2 | B (Microwaving Time) |
3 | A (Diameter) |
Click Fractional Factorial Design to access the MS Excel file
CONCLUSION
The ranking for both full and fractional factorial design is found to be the same where Factor C (Power) has the most significant effect on the amount of "bullets" formed, followed by Factor B (Microwaving Time) and Factor A (Diameter). This implies that the RUNS chosen for fractional factorial design is correct as the ranking matches with the full factorial design. From this, I can tell that fractional factorial design is a more efficient way to carry out the design of the experiment because lesser time and resources will be required while still achieving the same data trend and result. However, there is a problem with a fractional factorial design which is that it cannot capture all the data and may miss out on some interaction because it only favours some treatments.
Comments
Post a Comment